
| Compact overview of VAR_016723 | |||||||||||||
|---|---|---|---|---|---|---|---|---|---|---|---|---|---|
| UniProt ID | Gene | Mutation | Mutation type | Disease | OMIM | dbSNP | |||||||
| 1A01_HUMAN | HLA-A | I121M | Polymorphism | - | No OMIM entry | No dbSNP entry | |||||||
| Short stretch summary of VAR_016723 | ||||
|---|---|---|---|---|
| Predictor | Predicted regions overview | Comparison to WT | Stretches in variant | Stretches in WT |
| Tango |  | -11 No change | 6 | 6 |
| Waltz |  | -1 No change | 0 | 0 |
| Limbo |  | 3 No change | 5 | 5 |
| Domain composition of 1A01_HUMAN | ||||
| Database | Domain composition | Residue details | ||
| PFAM |  | MHC_I (Residues 25-203), C1-set (Residues 211-295), MHC_I_C (Residues 336-364) | ||
| SMART |  | IGc1 (Residues 222-293) | ||
| Structure stability summary of VAR_016723 | ||||
|---|---|---|---|---|
| Variant | Stability change | Effect | Structure | Stability frequency histogram |
| I121M | 0.79 kcal/mol | Slightly reduced stability |  |  |
TANGO aggregation
| Graphical comparison of TANGO regions in variant and wild type | |||
|---|---|---|---|
| Protein | Predicted regions overview | TANGO regions | Total score |
| Variant | | 6 | 2869 |
| Wild type |  | 6 | 2880 |
| TANGO regions in wild type and variant | |||||
|---|---|---|---|---|---|
| Wild type TANGO regions | |||||
| N-term gatekeepers | TANGO region | C-term gatekeepers | Start | End | Score |
| VMAPR | TLLLLLSGALALT | QTWAG | 8 | 20 | 44 |
| HSMRY | FFTSV | SRPGR | 32 | 36 | 6 |
| RGEPR | FIAVGYV | DDTQF | 46 | 52 | 77 |
| FYPAE | ITLTW | QRDGE | 237 | 241 | 13 |
| GTFQK | WAAVV | VPSGE | 268 | 272 | 11 |
| QPTIP | IVGIIAGLVLLGAVITGAVVAAVMW | RRKSS | 308 | 332 | 63 |
| Variant protein TANGO regions | |||||
| N-term gatekeepers | TANGO region | C-term gatekeepers | Start | End | Score |
| VMAPR | TLLLLLSGALALT | QTWAG | 8 | 20 | 44 |
| HSMRY | FFTSV | SRPGR | 32 | 36 | 6 |
| RGEPR | FIAVGYV | DDTQF | 46 | 52 | 77 |
| FYPAE | ITLTW | QRDGE | 237 | 241 | 13 |
| GTFQK | WAAVV | VPSGE | 268 | 272 | 11 |
| QPTIP | IVGIIAGLVLLGAVITGAVVAAVMW | RRKSS | 308 | 332 | 63 |
| Difference in TANGO aggregation between wild type and variant | |
|---|---|
 | This graph plots the per-residue TANGO aggregation score difference between the wild type protein and this variant. |
| TANGO aggregation profile score plot | |
|---|---|
 | This graph plots the per-residue TANGO aggregation score of the variant protein. From left to right, all residue scores from the N-terminus to the C-terminus are plotted |
| Molecular visualization of TANGO aggregation-prone regions | |
|---|---|
 Wild type 1A01_HUMAN |  Variant VAR_016723 |
These two molecular images show the TANGO aggregation-prone regions as red colored segments.
The left image represents the wild type protein, the right represents the variant protein. | |
WALTZ amylogenicity
| Graphical comparison of WALTZ regions in variant and wild type | |||
|---|---|---|---|
| Protein | Predicted regions overview | WALTZ regions | Total score |
| Variant | | 0 | 20 |
| Wild type |  | 0 | 21 |
| WALTZ regions in wild type and variant | |||||
|---|---|---|---|---|---|
| Wild type WALTZ regions | |||||
| N-term gatekeepers | WALTZ region | C-term gatekeepers | Start | End | Score |
| Variant protein WALTZ regions | |||||
| N-term gatekeepers | WALTZ region | C-term gatekeepers | Start | End | Score |
| Difference in WALTZ amylogenicity between wild type and variant | |
|---|---|
 | This graph plots the per-residue WALTZ amylogenic score difference between the wild type protein and this variant. |
| WALTZ amylogenic profile score plot | |
|---|---|
 | This graph plots the per-residue WALTZ amylogenic score of the variant protein. From left to right, all residue scores from the N-terminus to the C-terminus are plotted |
| Molecular visualization of WALTZ amylogenic regions | |
|---|---|
 Wild type 1A01_HUMAN |  Variant VAR_016723 |
These two molecular images show the WALTZ amylogenic regions as blue colored segments.
The left image represents the wild type protein, the right represents the variant protein. | |
LIMBO chaperone binding
| Graphical comparison of LIMBO regions in variant and wild type | |||
|---|---|---|---|
| Protein | Predicted regions overview | LIMBO regions | Total score |
| Variant | | 5 | 3193 |
| Wild type |  | 5 | 3190 |
| LIMBO regions in wild type and variant | |||||
|---|---|---|---|---|---|
| Wild type LIMBO regions | |||||
| N-term gatekeepers | WALTZ region | C-term gatekeepers | Start | End | Score |
| MAPRT | LLLLLSGA | LALTQ | 9 | 16 | 100 |
| DGSHT | IQIMYGCD | VGPDG | 119 | 126 | 11 |
| IALNE | DLRSWTAA | DMAAQ | 153 | 160 | 85 |
| FYPAE | ITLTWQRD | GEDQT | 237 | 244 | 100 |
| GLPKP | LTLRWELS | SQPTI | 294 | 301 | 97 |
| Variant protein LIMBO regions | |||||
| N-term gatekeepers | WALTZ region | C-term gatekeepers | Start | End | Score |
| MAPRT | LLLLLSGA | LALTQ | 9 | 16 | 100 |
| DGSHT | IQMMYGCD | VGPDG | 119 | 126 | 26 |
| IALNE | DLRSWTAA | DMAAQ | 153 | 160 | 71 |
| FYPAE | ITLTWQRD | GEDQT | 237 | 244 | 100 |
| GLPKP | LTLRWELS | SQPTI | 294 | 301 | 97 |
| Difference in LIMBO chaperone binding between wild type and variant | |
|---|---|
 | This graph plots the per-residue LIMBO chaperone binding difference between the wild type protein and this variant. |
| LIMBO chaperone binding score plot | |
|---|---|
 | This graph plots the per-residue LIMBO chaperone binding score of the variant protein. From left to right, all residue scores from the N-terminus to the C-terminus are plotted |
| Molecular visualization of LIMBO chaperone binding regions | |
|---|---|
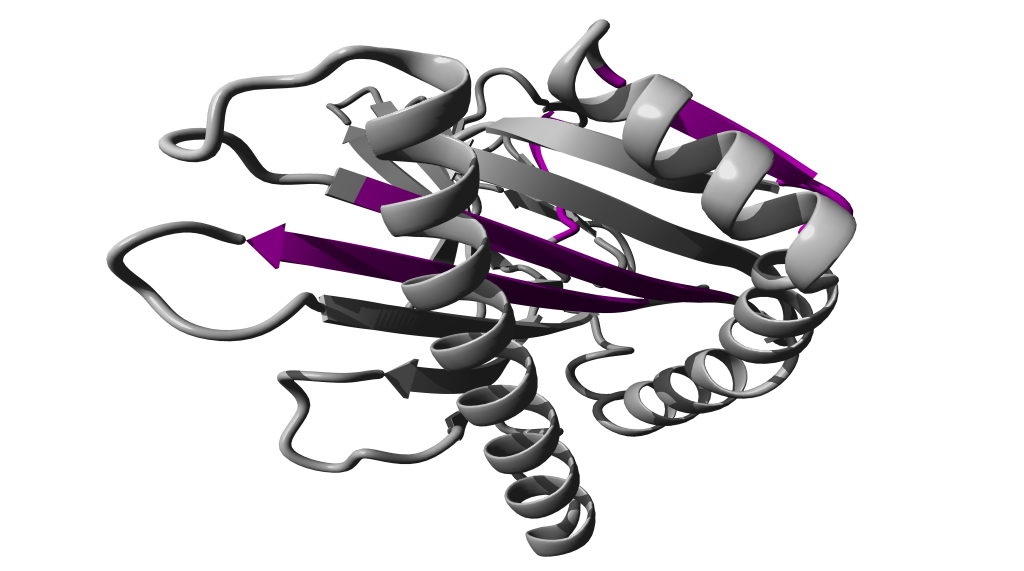 Wild type 1A01_HUMAN |  Variant VAR_016723 |
These two molecular images show the LIMBO chaperone binding regions as magenta colored segments.
The left image represents the wild type protein, the right represents the variant protein. | |
FOLDX structural profile
Functional sites, structural features and cellular processing
| Functional sites and structural features | |
|---|---|
| Feature | This residue |
| Catalytic site | No |
| Secondary structure | STRAND |
| Transmembrane topology | outside |
| Cellular processing | |
|---|---|
| Feature | Affected by variant |
| Signal peptide | No |
| Farnesylation anchor | No |
| N-Myristoylation anchor | No |
| Geranylgeranyl transferase Type 1 anchor | No |
| Geranylgeranyl transferase Type 2 anchor | No |
| Glycosylphosphatidylinositol (GPI) anchor | No |
| Peroxisomal targeting signal PTS1 | No |
| Subcellular location | No |
All mutations from 1A01_HUMAN
16 mutations listed
| Variant | UniProt ID | Mutation | Disease | Mutation Type | dTANGO | dWALTZ | dLIMBO | ddG |
|---|---|---|---|---|---|---|---|---|
| VAR_056253 | 1A01_HUMAN | R205H | - | Polymorphism | -1 | 0 | 0 | 1.35 |
| VAR_056250 | 1A01_HUMAN | N151K | - | Polymorphism | 0 | 0 | 0 | 0.24 |
| VAR_056251 | 1A01_HUMAN | I166T | - | Polymorphism | 0 | 0 | 0 | 0.96 |
| VAR_056252 | 1A01_HUMAN | R169H | - | Polymorphism | -1 | 0 | 0 | 0.31 |
| VAR_016725 | 1A01_HUMAN | V182A | - | Polymorphism | 0 | 0 | 0 | -0.31 |
| VAR_056247 | 1A01_HUMAN | R89G | - | Polymorphism | -1 | 0 | 0 | 1.57 |
| VAR_056248 | 1A01_HUMAN | G131W | - | Polymorphism | 0 | 0 | 9 | 3.3 |
| VAR_056249 | 1A01_HUMAN | F133L | - | Polymorphism | 0 | 0 | 0 | 1.23 |
| VAR_016723 | 1A01_HUMAN | I121M | - | Polymorphism | -11 | -1 | 3 | 0.79 |
| VAR_016724 | 1A01_HUMAN | R180L | - | Polymorphism | 0 | 0 | 1 | -1.91 |
| VAR_016721 | 1A01_HUMAN | A100E | - | Polymorphism | 0 | 0 | 0 | -0.04 |
| VAR_004333 | 1A01_HUMAN | R41S | - | Polymorphism | -1 | 0 | 0 | 1.04 |
| VAR_016720 | 1A01_HUMAN | M91V | - | Polymorphism | 0 | 0 | 0 | 4.3 |
| VAR_016719 | 1A01_HUMAN | G80R | - | Polymorphism | 1 | 0 | 0 | 0.47 |
| VAR_004332 | 1A01_HUMAN | F33S | - | Polymorphism | -34 | -6 | 0 | 6.14 |
| VAR_016722 | 1A01_HUMAN | D114A | - | Polymorphism | 0 | 0 | 0 | 0.42 |

